We use cookies to improve your online experiences. To learn more and choose your cookies options, please refer to our cookie policy.
18 June, 2024
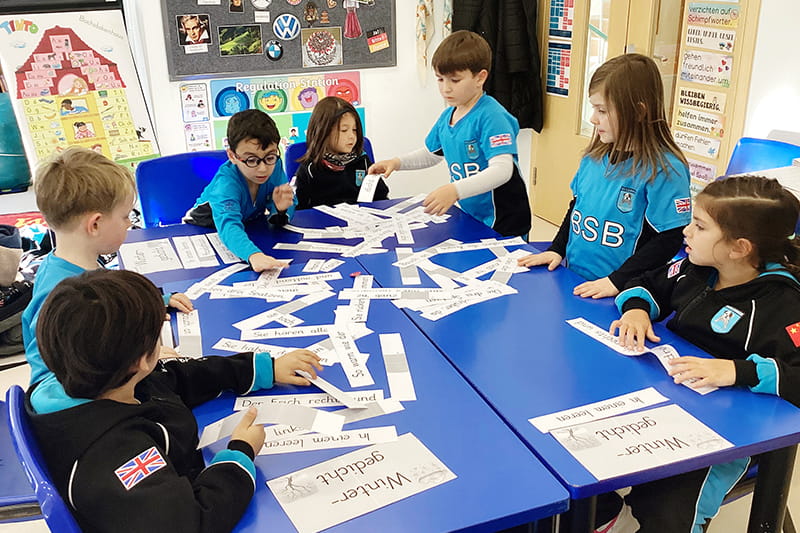
Statistics and Bar Charts in Year 3

An important component of Maths in education is linking the classroom learning to real life situations and skills. So as a nice and practical way to wrap up our Year 3 Maths unit on statistics, the classes designed their own surveys to collect data and represented this data in different ways.

They worked collaboratively in teams and came up with some interesting questions involving pets, sports, planets and colors. They then presented their representations to the class and discussed what they learnt from the surveys. The presenters were enthusiastic to talk about the data and there were many questions from the audience!
By James Barnard
Year 3 Hornbills Class Teacher
Related news
News image ![Growth | BSB Sanlitun - Growth]() Blog
Blog
 Blog
Blog Growth
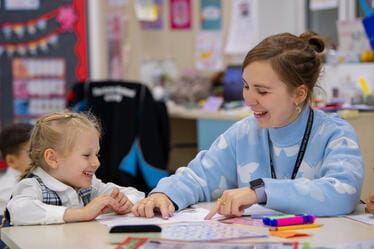
Our recent theme in Nursery focused on the topic of growth. We explored growth in a variety of ways, starting with ourselves, then looking at plants and animals. The results were amazing, and the children truly understood that growth means “getting bigger.”
News image ![Chinese Update | BSB Sanlitun - Chinese Update]() Blog
Blog
 Blog
Blog Chinese Update
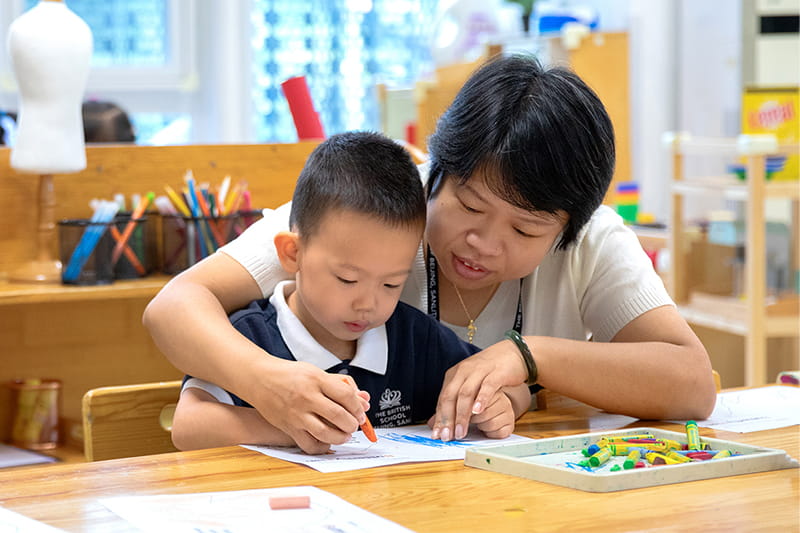
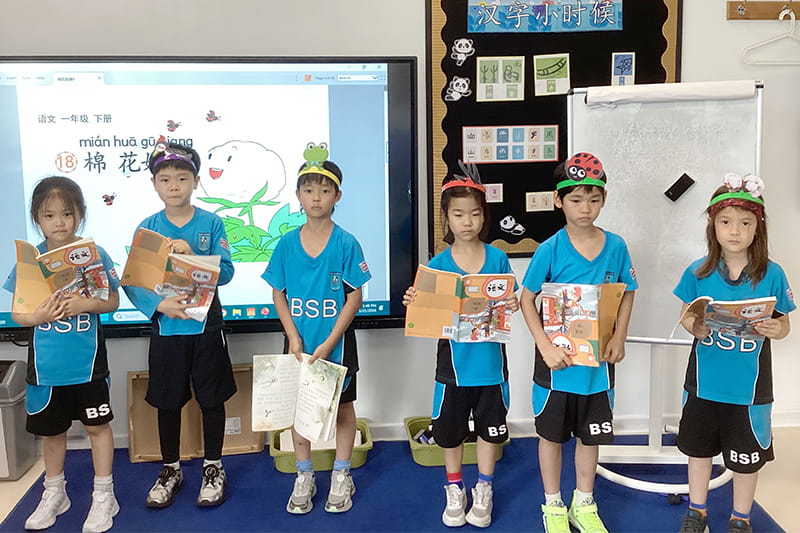
Over the past few weeks, our Chinese classes have been both lively and productive, with each year group exploring age-appropriate topics through interactive methods. From singing to role-play and creative art, students have been actively building their language skills while having fun.
News image ![It's Springtime in Pre-Nursery | BSB Sanlitun - Springtime in Pre-Nursery]() Blog
Blog
 Blog
Blog It's Springtime in Pre-Nursery
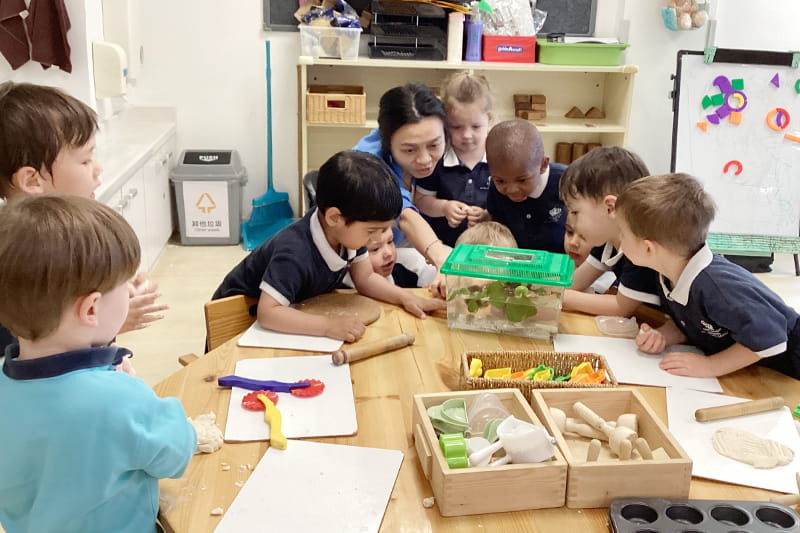
Pre-Nursery has been enjoying discovering the joy of springtime through creative, hands-on learning experiences filled with curiosity, exploration, and fun.
News image ![Magic of Words: Why Poetry Is So Important for Children | BSB Sanlitun - Magic of Words]() Blog
Blog
 Blog
Blog Magic of Words: Why Poetry Is So Important for Children
Poems open a playful door to language, rhythm, and creativity. They offer a wide range of possibilities for primary classrooms. Poetry enriches a child’s world in ways few other activities can. It strengthens the mind, deepens emotional awareness, and nurtures creativity. More than that, it fills everyday life with beauty, rhythm, and meaning.