Blog
More filters Reset
Reset
Blog
Growth
Our recent theme in Nursery focused on the topic of growth. We explored growth in a variety of ways, starting with ourselves, then looking at plants and animals. The results were amazing, and the children truly understood that growth means “getting bigger.”

Blog
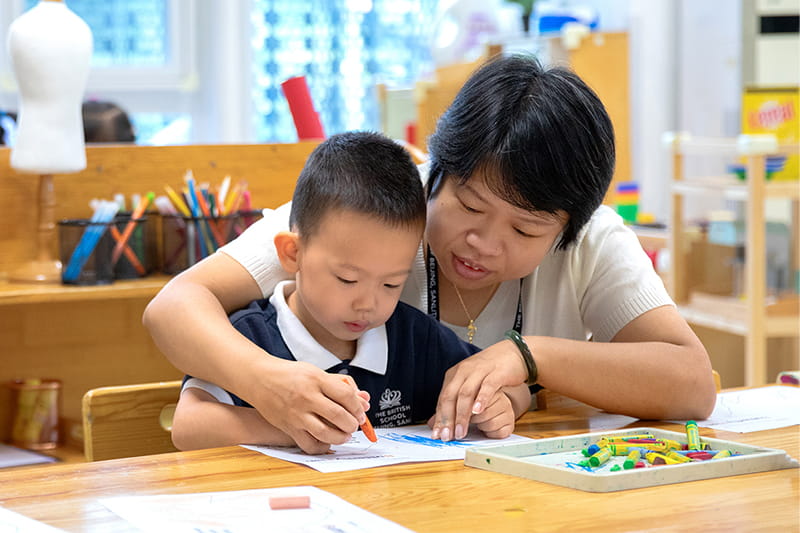
Chinese Update
Over the past few weeks, our Chinese classes have been both lively and productive, with each year group exploring age-appropriate topics through interactive methods. From singing to role-play and creative art, students have been actively building their language skills while having fun.

Latest News
News image Blog
Blog Growth
Our recent theme in Nursery focused on the topic of growth. We explored growth in a variety of ways, starting with ourselves, then looking at plants and animals. The results were amazing, and the children truly understood that growth means “getting bigger.”
News image Blog
Blog Chinese Update
Over the past few weeks, our Chinese classes have been both lively and productive, with each year group exploring age-appropriate topics through interactive methods. From singing to role-play and creative art, students have been actively building their language skills while having fun.
News image  Blog
Blog
Blog It's Springtime in Pre-Nursery
Pre-Nursery has been enjoying discovering the joy of springtime through creative, hands-on learning experiences filled with curiosity, exploration, and fun.
News image  Blog
Blog
Blog Magic of Words: Why Poetry Is So Important for Children
Poems open a playful door to language, rhythm, and creativity. They offer a wide range of possibilities for primary classrooms. Poetry enriches a child’s world in ways few other activities can. It strengthens the mind, deepens emotional awareness, and nurtures creativity. More than that, it fills everyday life with beauty, rhythm, and meaning.
News image  Blog
Blog
Blog Bringing Maths to Life Through Practical Learning
In Year 4, we have been really enjoying finding ways to make maths feel active, meaningful and fun for the children. We know that children learn best when they can see ideas, talk about them and have a go themselves, so we regularly use practical resources to help bring mathematical concepts to life.
News image  Blog
Blog
Blog The Importance of Residential Experiences
Residential experiences play a vital role in a child’s primary education, offering opportunities for growth that extend far beyond the classroom. While they are often seen as a highlight of the school year, their true value lies in the way they support children to develop independence, resilience, strong interpersonal skills in a real-world context and memorable learning.
News image  Blog
Blog
Blog The Value of Lunchtime Recitals in Primary School
At BSB Sanlitun, lunchtime recitals provide a unique and valuable platform for primary students to develop confidence, creativity, and a sense of achievement in a supportive environment. Unlike formal concerts, these informal performances allow children to share their musical progress with peers in a relaxed setting, helping to reduce performance anxiety and build resilience over time.
News image  Blog
Blog
Blog Term 2 ASA Awards Assembly
Term 2 ASAs have come and gone in a flash, and what a fantastic term it has been. We have enjoyed a wonderful season of sport, with regular fixtures across football, handball, table tennis and dodgeball. It has been great to see so many students representing the school, developing their skills, and showing excellent teamwork and sportsmanship throughout.
News image  Blog
Blog
Blog Getting creative with clay in Year 2!
Year 2 have absolutely loved designing and creating their own clay dragon eyes! They began by sketching ideas, using different techniques to add detail and imaginative patterns...
News image  Blog
Blog
Blog Outdoor Learning in Nursery
Our outdoor learning area has been full of excitement as the children enjoy the changing season. With the arrival of spring, they have been exploring the outdoors, noticing new leaves growing on the trees and colourful flowers beginning to bloom...
News image  Blog
Blog
Blog Enthusiastic, Confident EAL Learners
This week in EAL, our classrooms have been buzzing with energy, enthusiasm, and very importantly with confidence! Across all year groups, students have been stepping out of their comfort zones, using their voices, and showing just how much their speaking skills are growing. We are so proud of their courage and progress.